Grafana
Grafana configuration
Istio provides preconfigured Grafana dashboards for the most relevant metrics of the mesh. Although Kiali offers similar views in its metrics dashboards, it is not in Kiali’s goals to provide the advanced querying options, nor the highly customizable settings, that are available in Grafana. Thus, it is recommended that you use Grafana if you need those advanced options.
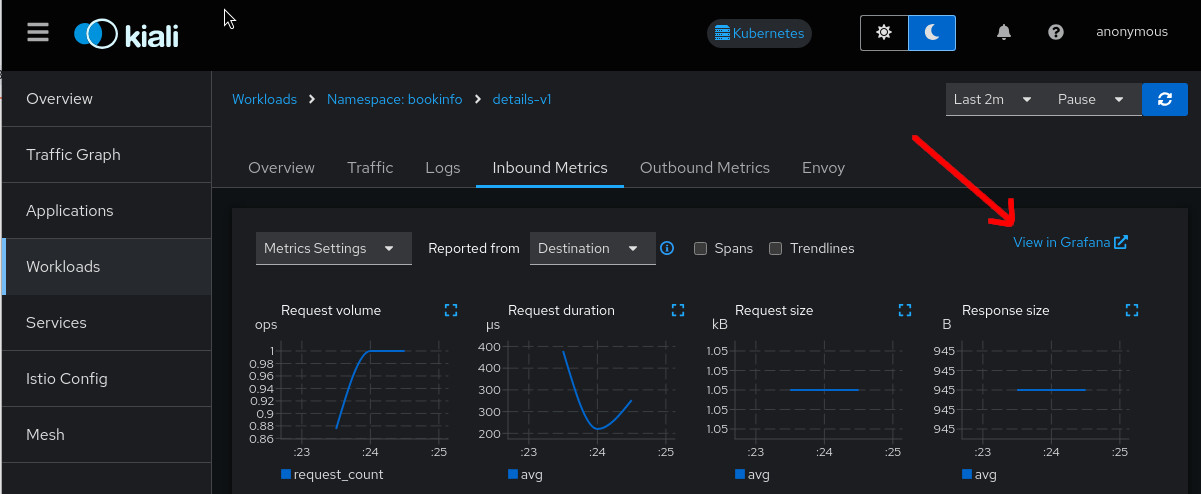
Kiali can provide a direct link from its metric dashboards to the equivalent or most similar Grafana dashboard, which is convenient if you need the powerful Grafana options.
The Grafana links will appear in the Kiali metrics pages. For example:

For these links to appear in Kiali you need to manually configure the Grafana URL and the dashboards that come preconfigured with Istio, like in the following example:
spec:
  external_services:
    grafana:
      enabled: true
      # Grafana service name is "grafana" and is in the "telemetry" namespace.
      internal_url: 'http://grafana.telemetry:3000/'
      # Public facing URL of Grafana
      external_url: 'http://my-ingress-host/grafana'
      dashboards:
      - name: "Istio Service Dashboard"
        variables:
          namespace: "var-namespace"
          service: "var-service"
      - name: "Istio Workload Dashboard"
        variables:
          namespace: "var-namespace"
          workload: "var-workload"
      - name: "Istio Mesh Dashboard"
      - name: "Istio Control Plane Dashboard"
      - name: "Istio Performance Dashboard"
      - name: "Istio Wasm Extension Dashboard"
Grafana authentication configuration
The Kiali CR provides authentication configuration that will be used to connect to your grafana instance and for detecting your grafana version in the Mesh graph.
spec:
  external_services:
    grafana:
      enabled: true
      auth:
        ca_file: ""
        insecure_skip_verify: false
        password: "pwd"
        token: ""
        type: "basic"
        use_kiali_token: false
        username: "user"
      health_check_url: ""
To configure a secret to be used as a password, see this FAQ entry